Wednesday, December 28

Market in the Rear View: Looking Forward


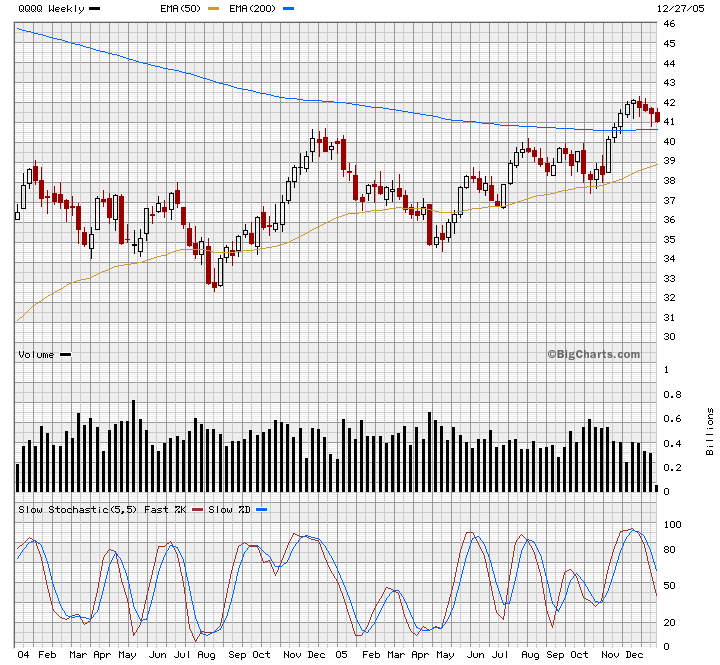
Using the qqqq as a proxy for the stock market, here is a two-year weekly chart showing the nasty fall the market took at the beginning of last year; dropping about 1/8th of its value in the first three months of the year and then using the Spring and the Fall to recover.

$40 has been the key level during this period for the q's, providing resistance to the upside, and will also provide support, when the stock starts to break lower.

This last end-of-the-year rally has been low on volume, and looks to be running out of steam. The return to the $40 level for a test will not be far off.

Short rates have risen and may continue to do so as the Fed attempts to fight the very real threat of rising prices, i.e. "domestic dollar devaluation"; a problem which was created, of course, by the Fed itself.

The yield curve has inverted, increasing the odds of a recession next year. An inverted yield curve simply means that it no longer pays banks and other financial institutions to do what they do: borrow short term money to lend it long term. It's selling something for less than you buy it for, over and over again.

When lending is unprofitable, the boss hits you over the head and tells you to knock it off. So all sorts of productive activity doesn't get financed and that means it doesn't happen. Business slows. Bubbles burst. people feel poorer.

What could prevent a recession from happening next year?

The always easiest answer is that the Fed could return to her old ways and start pumping it out again like the drunken prom queen she is. Stop kidding us honey, you know you love it!

Another very real possibility is that some kind of tax reduction legislation gets pushed through sparking another growth cycle with an unexpectedly big market upside.

The establishment fears deflation like a liberal fears virginity; odds are, they'll do whatever it takes...

Tuesday, December 27

Greenspan: The Trailer...

Stefan M.I. Karlsson, like Murray Rothbard before him, isn't pulling any punches when it comes to Alan Greenspan and his legacy.

"...apart from inflation and economic imbalances, the defining characteristic of the Greenspan Fed has been its dishonesty. We have already seen how Greenspan claimed to have mimicked gold standard conditions. Moreover, instead of admitting how he was responsible for the tech stock bubble through the creation of moral hazard and suppression of interest rates, he blamed the bubble on "irrational exuberance." And instead of admitting his role in creating the housing bubble, he denied that there was such a bubble. Later, when he admitted that the housing bubble was real, he spoke out against it as if he had nothing to do with having created it in the first place."

Wednesday, December 21

A Low Inflation Kind of Year?

The Labor Department tells us that we actually experienced Deflation in November--consumer prices dropped by 0.6%.

Bill Fleckenstein is approriately skeptical about the accuracy of the official "inflation" numbers put out by our public servants in Washington, D.C.

Sunday, December 18

Fed Abandons M3: what's up with that?

John Williams, at prudentbear.com, has some suspicions about the central bank's ending its publication of the broad monetary aggregate M3. What are they trying to hide?

Sean Corrigan over at the Mises.org blog takes an even bigger swing at it, foreseeing dire straits for the dollar and consequently much higher rates for the long bond.

On a separate note, here's a monthly 5 year chart of the anti-dollar, i.e., gold:

Saturday, December 17

Review: St. Jude Medical


STJ gave us a freebie, so we might as well take it and run.

We sold the Jan 45-50 put spread at $2.75 when the stock was trading at $47.75; now that the stock has gapped up quickly over the $50 mark up to $51.75 The put spread is $.70 bid, at $.85.

We'll buy it back for $.80 and we are out of the trade with a $1.95 profit ($195 per put spread).

We'll wait for the stock to come in again before taking on a new position. Volume is still way positive and the uptrend should continue. Watch for support at the 200 day MA.

Stock: China Medical Tech


CMED looks like it is resting before a strong move in one direction or the other. In the month of December the stock has quieted down and has found support above its 50 day moving average. But when it does move, will it be to the upside or downside?

The big reversal day in late November showed active sellers overwhelming the momentum buyers and bringing the stock price down to a more moderate rate of increase. But the uptrend is unbroken and a pullback was due. Now that the expectations for easy money have been diluted, the volume patterns show the stock is still being accumulated.

CMED is also listed in IBD's "New Buys of Top Performing Stock Funds" for November, meaning that some smart institutional money is buying it.

Furthermore, at least through the end of the year, we are in a very positive period for the stock market and so we ought not to bet against the upside.

I know what you're thinking: "let's get long the Jan 35-40 call spread for about $1.50 and see what happens".

Okay, good call. You're getting better at this.

Monday, December 5

Stock Watch: INGR


This is another strong stock with high Investors Business Daily ratings. It's uptrend continues with its current consolidation. Institutions would rather not buy a stock too far away from its fifty day MA so they often refrain from their planned accumulation when the stocks price gets too far away.

Now the stocks historical volatility has come in from 28 down to 18 but the implied vol in the options market is still up around 26.

Since we think the stock is going up and vol is high, we need to get long by selling premium. The preferred method is selling put spreads, rather than naked puts which leave us open to big losses.

The INGR Jan 45-50 put vertical is fair at 1.90--selling the Jan 50 put @ 2.40 and buyin the Jan 45 put for .50.

Let's sell the spread there and watch.