Monday, November 14

Example: Selling an STJ Put Spread


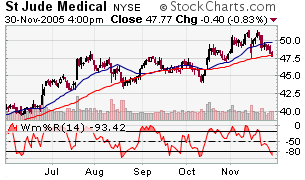
St. Jude Medical is a company with strong fundamentals in a solid group, and it has every reason to be in an uptrend. It formed an eight week base starting in August and broke above the buy point of 47 1/2 mid Oct. and up to 52, where it sold off and has returned to the 200 day moving average holding at 47 1/2. So how should you bet it?

Since the stock is still in an intermediate uptrend we look for a time and place to get long. The safest place is at the support of its long term averages when the stochastics are low and turn up, in this case when the williams% drops below -80, then heads back above it.

One way to make a bet that this stock will go higher from here is to SELL a put spread.

When the stock goes higher, the put spread will get cheaper. You can then buy it back at the lower price; or even better if the stock has moved high enough, let the price of the put spread go to zero at expiration and just pocket the money from the original sale.

The best thing about vertical spreads is that your losses are limited.

If you use strikes that are 5 points wide, like the STJ 45-50 put spread, its value will always be between $0 and $5. If you bought it for $1, the most you could lose would be $1; if you sold it for $1, the most you could lose is $4.

So let's look at the STJ Jan 45-50 put spread. With the stock at about $47.75, this put spread is trading for 2.75, or $275 apiece. Selling it there would put $275 into your acount now and if STJ went over $50 and stayed above it at the Jan expiration of those options, you would simply keep the money.

If STJ went below $45 and stayed there at the Jan expiration, you would lose the $275 plus another $225 of you own cash because the price of the put spread that you sold for 2.75, would go to 5. But you can buy it back at any time before expiration to get out of the trade, either to capture a profit or to keep from losing more.

Now with STJ in an uptrend and the stochastics about to turn up, let's paper trade the put spread, selling one at 2.75.

We'll watch it and update in the near future.

Sunday, November 13

Recent New High in the Q's


Here is the weekly chart of the Q's. A new high, yes, but where is the volume? over the last dozen weeks the volume was on the downside and now in the new rally the up weeks are tainted with modest trading activity.

Buying activity did pick up underneath the 50 day moving average, giving support there, but so far aggressive buying has been absent. If this is the start of the rally season, shouldn't there be more people in attendance? Hmm.

Okay, I'll keep a wait and see attitude. But the Fed rate hikes do continue, and this is the first year of the Presidency, classically the poorest performing of the four year Presidential cycle as the Fed tends to pull the punchbowl away after their election year manipulations have done their trick.

But rally time is rally time, and the market is showing better and broader leadership this time around.

The rotation has been out of the oil and housing stocks and into certain retail, financial, medical and transport stocks. More to come on the individual winners in the near future; stay tuned.

Friday, November 11

Real Estate Futures to Trade at the CME

Set to debut in April at the CME, this futures contract will be "based on the median home price in ten U.S. cities".

The exchanges are continuing to offer new products in an effort to compete with newcomers for order flow. Some have gone public already, and more will surely follow. Let's go to the charts to see how they're doing.


The ISE is an all electronic options exchange here in the U.S. in competition with the five others, four of which are floor-based. It has run up about 30% in the last month, and is at risk of a little correction as those holding paper profits might be quick to take some off the table. But the volume shows big accumulation and the stock is a great bet for the long haul. A good buy around $27 1/2 if it comes in.


The Arca exchange has already started to come in after a quick runup from $40 on strong volume. As long as it continues to act well, it would be a great buy at $45, at the 50 day moving average.

The small group of publicly traded exchanges, which includes BOT, NDAQ and of course the CME, will continue to innovate and grow as public firms. They should be considered for the trading vehicles that they are, and also as good investments.

Thursday, November 10

Big Cap Stocks of the Week

Here are the charts of the highest rated big caps according to Investors Business Daily, based on their proprietary composite ratings.


Motorola looks great with strong volume on the up days, a convincing break above its 200 day moving average, and a methodical base building process as it approaches the break out point at $24. It would be best if it had one more shake out to form a handle, before the big volume break out to new highs.


St. Jude Medical is also in an orderly uptrend, with the big volume days on the upside. It is one of the leading stocks in the strong medical sector and is showing good action after its break out at $47 1/2. A break above $50 with the continued support of its 50 day average could leave this stock a longer-term winner.


Norfolk Southern is in the very strong transports sector, has broken above a short-term base at $41, and shows the signs of volume accumulation and support in the moving averages.

The big caps tend to be less volatile, have a lot of liquidity, and have very active options markets behind them, leaving many ways to gain from their movements.

Now go forth and prosper.

Wednesday, November 9

Broad Market Indexes

Here are the latest 6 month charts for a quick look at the state of the stock market.

Notice the recent run up in the Dow Transports and the flatline of the utilities during the Bull of the last few weeks. What does that tell you about the markets expectations for interest rates?

Utilities are one of the most rate sensitive sectors of the stock market. They don't do well when interest rates rise because their earnings are strongly affected by the cost of borrowing money; they are heavy debtors. When that cost is low, their earnings are high, when that cost is high their earnings are low.

Transports are strong when the economy is running strong or soon will be. Their earnings rise as they are booked to ship more goods to and from manufacturers and to their final destinations; the Dow transports are indicating an uptick in the economy which leads to a greater demand for credit, and higher rates as a result.

During the past year, businesses were getting squeezed between higher commodities prices which they pay to produce goods and services, and an inability to pass them on in the form of retail price increases.

Now however, the lid may be coming off the prices that they are able to charge, and they are anticipating larger profits in the near future as a result.

Given all this and the fact that the ten-year Treasury yield has gone from 4.0% to over 4.6% in short order, it looks like long rates will be rising with short rates, and the yield curve will continue to steepen.

But will it last if the Fed keeps raising rates?

At least for a little while, yes.

Thursday, November 3

Bonds and Futures Links

A couple of more links, then I'll get back to business.

Here is a bond yield summary from BondsOnline.com; and a very concise futures page from Barchart.com.

Thanks to PrudentBear.com for both.