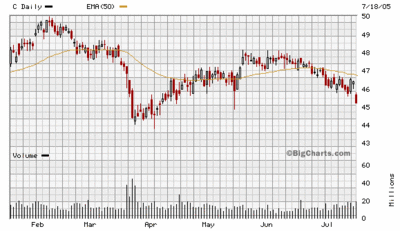
Citigroup earnings disappoint due, in part, to a flattening yield curve; it's fixed-income markets revenue dropped by 28% from the prior year. The stock is currently down about 2.5% on the day and has been the catalyst for a weak banking sector.
When short-term rates are high relative to long-term rates, bank margins get squeezed. Since they are in the business of borrowing "short" and lending "long", when their cost of funds rises (short rates), while the price they charge others to borrow them remains the same (long rates), their profits dissappear.
The yield curve itself is a product of both the market, and government intervention. The Fed has been hiking up short rates in order to keep inflation at bay, and to keep speculative markets like real estate, from getting out of hand. But longer-term rates like the ten year T-bond yield, are set by the market, and have remained stubbornly low.
If short rates continue to rise and surpass long rates, the yield curve will then be negative, and that does not bode well for the economy or the stock market. Financing begins to dry up as lending money becomes unprofitable, and business activity slows down as a result.
And even a well diversified banking powerhouse like Citigroup will feel the pain of an unacknowledged business cycle.
Monday, July 18
Tuesday, July 12
Single-digit Implied Volatility
The Treasury Bond real interest rate
An interesting look at the current bond market interest rate conundrum throught the lens of Austrian Economic theory, via Mises.com.
The problem is that the current real interest rate is roughly zero, the exact number being dependent upon how you arrive at the true rate of inflation, and therefore, what you think it is; government supplied numbers are never quite what they seem.
If the current nominal market rates are the result of an artificial stimulation by the central bank, then the coordination between the time-preferences of savers, and the time-preferences of borrowers will be all screwed up, leading to further boom/bust cycles in the economy and a genuine loss of wealth.
Tuesday, July 5
QQQQ and the Moody Blue
Saturday, July 2
Money Supply heading South of the border
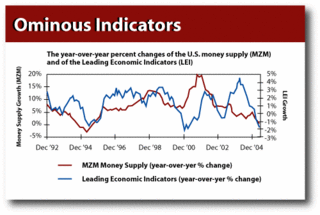
This graph from an article over at The Daily Reckoning gets to the heart of the matter. The stock market is in for a heap of trouble this fall given this kind of monetary environment. MZM has gone negative and the yield curve is flattening, and may go negative as well.
This adds up to a recession for the economy and a downtrend for the stock market, with the possibility of a good old fashioned whacking before the end of the year. The August-September time period is the most likely candidate for the lows of the year, according to The Stock Trader's Almanac put out by Yale Hirsch, and the year after a Presidential election tends to be the worst.
If this is true what should you do? If you've already made some money this year on a good pick or two, think seriously about banking it, or at least hedging. If you want to make some money on the possible down turn, buy some puts.
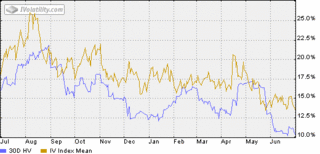
Implied vols, which means options prices, are low at this point, i.e., calls and puts are cheap. This varies from stock to stock of course but as an example, let's take a look at the QQQQ options:
As you can see, the implied volatility (yellow line) of the Q options is at a low. Notice how it spiked up in August of last year, which is another way of saying that the calls and puts suddenly became a lot more expensive, or that those who had the foresight to buy them just prior, made a lot of money. Will this August be the same?
Of course no one can predict the future, but those who consistently make money at anything know to place their bets when the odds are in their favor, and reduce their risk when the odds are against them.
Subscribe to:
Posts (Atom)