Tuesday, January 31

Trading and Innovation

Trading is a boom industry. Here are the graphs of some of the more interesting publicly traded trading related companies in the United States.

Look at the Chicago Mercantile Exchange, CME. After forming an eight week base on top of a long run up, it still has the strength to break out to new highs above $400.

The Chicago Board of Trade, BOT, an IPO from last year is also doing well. The quick money is gone. It may now be in stronger hands and under accumulation. Yahoo Finance shows that The Vanguard group is the only significant holder but a few other big funds have started to take positions at the end of last year.


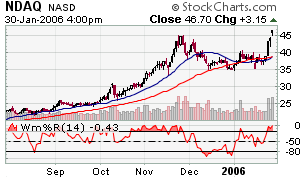
Both the Arca Exchange, AX, and the Nasdaq, NDAQ, have shown big volume rallies off of their moving average supports with similar chart patterns.

AX of course owns the Pacific Exchange and is merging with the NYSE.


Do you want a link to most of the exchanges around the world? I found a pretty good one here.

This stodgy old industry is becoming more dynamic as new technology forces its way in, and those who refuse to innovate, get bought out or die.

Competition from abroad forces regulatory changes in the United States and elsewhere that never would have occured without it. Those who benefited from the lack of competition in the past would have watched their order flow dwindle down to a trickle.

The Self Regulated Organization, SRO, model is a failure. A P&L is crucial in decision making. It forces institutions to serve real people, and rewards the best for doing so efficiently.

This is an industry that is slowly being released from its bureaucratic bondage, into a world where it has more to gain from tech innovation than any other. These firms will come to realize that they are nothing more than networks.

An exchange used to be defined by its location. But no longer. The concept of an exchange is being released from its earthly location. If the Pacific exchange abandons it's trading floor in San Francisco and goes virtual with all of its market makers participating electronically, is it still the PCX? The customer may not even notice a change.

...and you are holding IBM in your IRA?

Genius.

Monday, January 30

Time's Up

According to the Stock Trader's Almanac, the end of January signals the end of the best three months of the year for stocks. The average gain for the Nasdaq since January, 1971 is 3.7%.

For the S&P 500, the probability of an up day today is about 67%, but tomorrow is historically one of the best trading days of the year with the probability of an up day at 81%.

It also happens to be the day of the FOMC meeting.

Bernanke's coming, look busy.

Saturday, January 28

Half-Point Rate Increase from the Bernanke Fed?

Jim Otis over at Prudentbear.com speculates on one rate manipulation strategy for new Fed Czar Bernanke.
As an exercise for the students, compare and contrast the results from raising a boring quarter point now and another quarter point at the next meeting, versus a bold half point increase now and no increase at the next meeting. The following Fed meetings will show the timing value of a sharp increase in rates now. By then, the media will talk about little more than the dreaded deflation toward which our economy is surely falling, and the Fed will be able to cut rates by a half point at each of the next few meetings to protect us from the dastardly deflation fate which would otherwise crush our economy (despite the contrary evidence offered by energy and metals prices which will be setting new record highs). Those sharp rate cuts over the spring and summer, combined with the ever increasing M3 money supply which will no longer be published, will have our economy running at full speed again by late fall, and will push stock prices to record highs. Coincidentally, that will put voters in a good mood by November.

If you were the new head of the Fed how would you play it?

Tuesday, January 24

GM, Kerkorian Outed by Matias

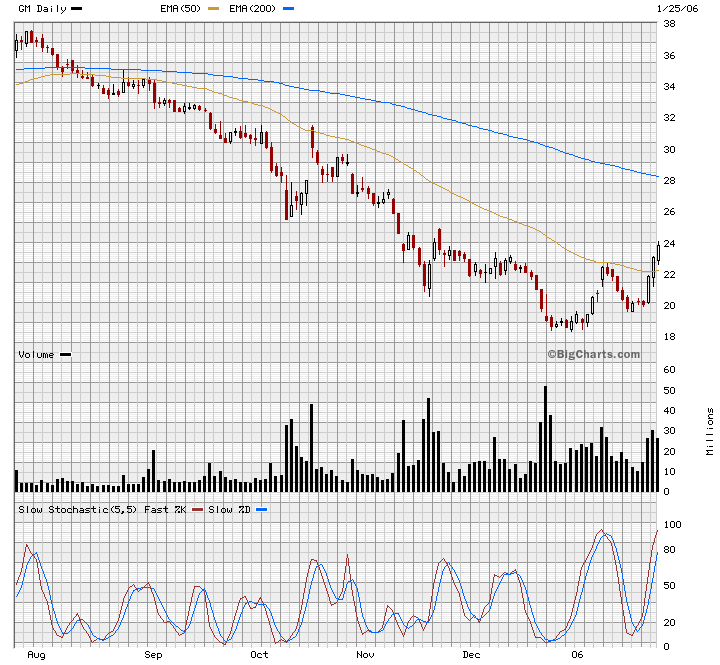
In my last post I noted that GM showed unusual strength on that big down day on Friday. Evidently much of that strength was due to Kirk Kerkorian's stealthy accumulation of More GM shares on the cheap, raising his stake to 10% of the company.

Kerkorian, rumored to be a dedicated reader of this blog, The Moon and the Sixpence, realized he'd been outed and decided to go public with his activities.


Note the last three bars (elongated) are the Monday, Tuesday and Wednesday just past. Friday, which on most other stock charts is a big red slash, is an almost nonexistent dot on GM's chart.

Why is he buying again?
His latest move may indicate he believes GM is listening to his ideas for improving the company. In a speech to Wall Street analysts this month, Kerkorian's top aide Jerome York called on GM to cut its annual dividend in half and set profitability goals and a timetable for achieving them.

York said Kerkorian was interested in buying more GM shares and was optimistic about its recovery efforts, but he said it was time for GM to get into a "crisis mode."

GM just broke it's intermediate term downtrend. The company will report quarterly and full year results today.

Sunday, January 22

Dow Check

Here are the graphs for most of the Dow stocks.

Of the bunch, McDonalds is the only one that had a strong up day on Friday, when most of the market got whacked.

T, Pfizer and Merck showed mild relative strength. And surprise surprise, GM may be forming a bottom while no one else is paying attention.

Nasdaq Check


With the QQQQ as a proxy, on a 3-year chart showing strong support at $40. Let it come in, then if the market action starts to look better, get long.

Friday, January 20

INGR Closing

We are short the Jan 45-50 put spread which means we are short the 50 puts and long the 45 puts. On expiration both will go to parity at the end of the trading day. Since the stock is around $49.50, parity for the 50 puts is 50 cents, and for the 45 puts zero.

All we really need to do is buy back the short 50s before the close.

Assuming that the market will be neutral, the stock should be drawn to $50 a share intraday and when it is, those 50 puts will have little value--their price will drop. So when the stock makes a run up through fifty, we should buy them back. Going into the morning let's keep a 20 cent bid in mind. But unless the stock runs up big, we will buy them back by the close.

To remind you, the opening trade was selling this put spread for $1.90. Let's see how well we do closing it.

Thursday, January 12

AAPL legging Out

Apple, we'll be an $.85 bid on our Jan 80 puts to close. If it trades, we'll still be long the Jan 75 puts from the spread we sold on Monday.

Quick Charts; Oil and Exchanges

Here are a few good oil related stocks and exchange and trading related stocks. We'll need them in the future.

Wednesday, January 11

CMED Out


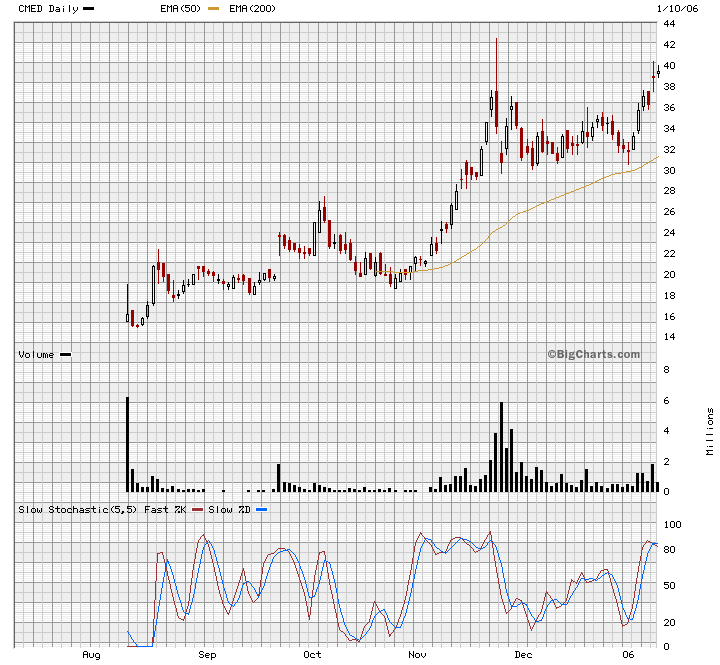
Just as I thought, the stock tried to punch through the $40 mark, as you can see on this intraday chart, but failed and closed down.

Fortunately we had a $5.80 offer out on the Jan 35 calls which got taken out on the stock's run up, and we then closed out the other part of our vertical, the short Jan 40 calls, to close.

Bought for $1.50, sold for $3.60.

$210 profit per spread on the initial $150 investment.

CMED, Legging out


We paid $1.50 for the CMED Jan 35-40 call spread--buying the Jan 35 calls and selling the Jan 40 calls--and since the stock has met our expectations we are looking to get out as the stock hits a ceiling at $40.

But CMED presents a problem common to stocks with illiquid options markets; the bid-ask spread is wide and we don't want to give that much money away.

On tuesday the stock closed at $39.41, and the Jan 35 calls, the part of our spread that we are long, was $4.60 bid, at $5.40--$.80 wide. Too wide.

We'll put out an offer to sell this Jan 35 call at $5.80 and see what happens. Why?

If the rest of the market is neutral we can bet that CMED will make another attempt at crossing above $40, even if it does not close above it. When it does make the run, those Jan 35 calls, which are deep in the money, will move up almost as much as the stock itself.

So if the stock moves up the required $.60 to hit the $40 mark, the calls should move up, let's say $.50. The $5.40 offer on the exchanges will rise to $5.90 uncovering our offer at $5.80--and we will become the best one; the next to sell to those momentum call buyers.

Even if the professionals keep lowering their offer to remain the best one, the stock may continue to rise and they will be forced to fade and maybe buy our call themselves in order to get us out of their hair.

Once we sell the 35 call we can pay the offer on the Jan 40 call or work out of it, and we will be out of the spread.

In the real world you can react to the market in real time, but it is always good to go into the trading day with a plan. As old Gomp used to say "ya've gotta have a plan". Of course that always included a sixer of King Cobra...

Saturday, January 7

STJ Missed


Do you like apples?

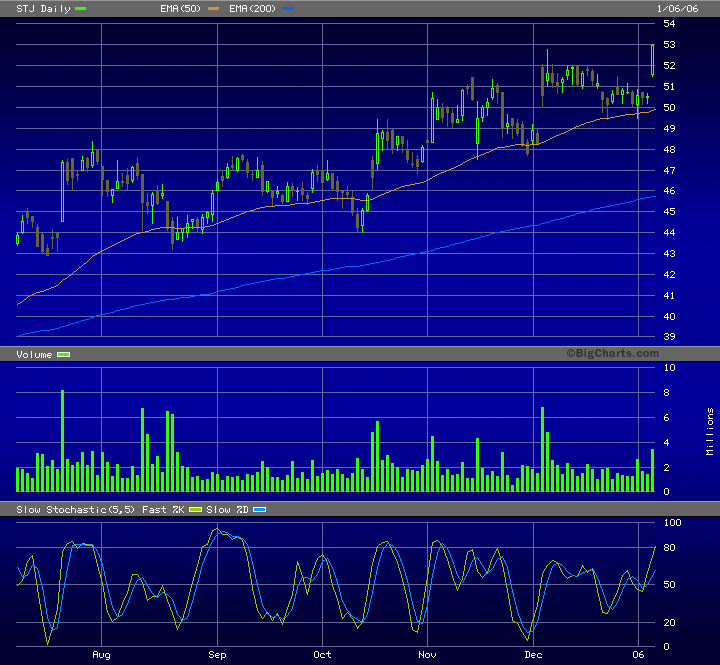
Well I turned around and wasn't paying attention to STJ for a few days while it came back in to $50 and support at its 50-day moving average and so I missed my chance to sell the Feb 50-55 put spread for fat cash how do you like them apples?

AAPL Trade


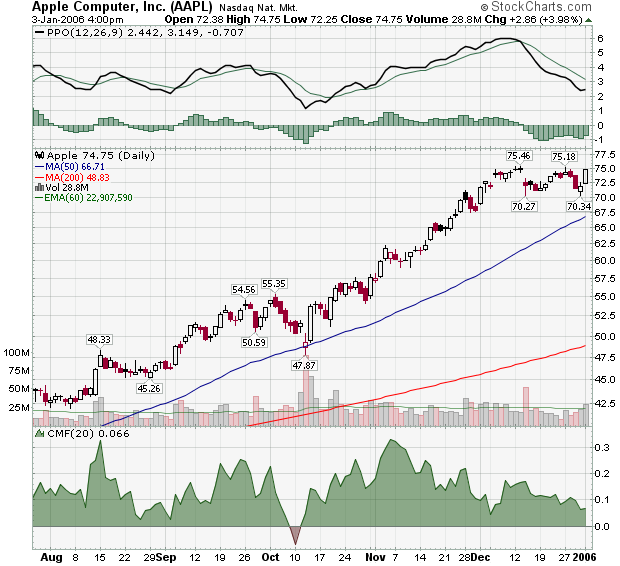
AAPL Jan 75-80 put spread let's hypothetically sell it at a $3.20 limit. If the stock comes in closer to $75 during the day (mon.) it might get taken. The stock should find support @ $75 after it broke through and closed above resistance there.

As we've noted before, vertical spreads have a limited profit and a limited loss. To sell a Jan 75-80 put spread, you have to sell a Jan 80 put and buy a Jan 75 put. The difference between the two prices is what the spread trades for, if we sell it, someone else buys it.

Then net amount of money goes into our trading account and sits there until we close out the trade by buying the same spread back. Hopefully for a lot less than we sell it for if our offer gets taken.

Stay tuned...

Friday, January 6

China Shifting Away from the Dollar?

If so, the dollar gets weak and long term bond yields rise.
Economists estimate that more that 70 per cent of the reserves are invested in US dollar assets, which has helped to sustain the recent large US deficits. If China were to stop acquiring such a large proportion of dollars with its reserves - currently accumulating at about $15bn (EU12.4bn) a month - it could put heavy downward pressure on the greenback.

Goods imported to the U.S. will themselves become more expensive, and will no longer have as much of a dampening effect on domestic prices here, paving the way for a "surprising" uptick in future CPI numbers, including the phony "core" rate of inflation.
However, according to Stephen Green, economist for Standard Chartered in Shanghai, although the language was "vague", Thursday's statement was the first time Safe has publicly indicated a shift away from dollar assets.

"It is a subtle but clear signal that they are interested in moving away from the US dollar into other currencies, and are interested in setting up some kind of strategic commodity fund, maybe just for oil, but maybe for other commodities," he said.

And their appetite for commodities from around the world will continue to grow. Thanks to prudentbear.com for the pointer.

Thursday, January 5

Under the Skin, All Central Banks are Alike

On the Prudence of China's central bank, again from Bloomberg.com:
"The People's Bank of China plans to restrict growth in M2, the broadest measure of money supply, to 16 percent this year, the central bank said on its Web site, citing an annual working conference held yesterday."

And Citigroup's best chimes in...
``The M2 target is in line with the aim of having a healthy and stable policy,'' said Huang Yiping, Citigroup Inc.'s Hong Kong-based chief Asia economist.

He makes it sound so easy...
``The M2 target is in line with the aim of having a healthy and stable policy,'' said Huang Yiping, Citigroup Inc.'s Hong Kong-based chief Asia economist. ``We aren't expecting any big tightening moves until inflation picks up and becomes a risk.''

China's consumer prices rose 1.3 percent from a year earlier in November, compared with a 1.2 percent gain in October. Inflation has eased from a high of 5.3 percent in July and August 2004 after the government clamped down on bank lending to industries such as steel and real estate.


It will be fun to watch all of this unfold.

No Inflation Here

"Inflation? What inflation? Didn't we tell you the core CPI was low--nothin' you needed to worry about?"

Yeah, sure.

Another piece by Bloomberg (Commodities rise to Record...) in the growing body of evidence, that in spite of the 13 headline-capturing rate hikes by the Fed, it has actually been a prolonged period of easy money.

The core rate of inflation is only two percent, you say? Man, you are well trained!

From a story over at the Financial Times (FT.com), metals prices continue to surge.

More to follow...

Wednesday, January 4

AAPL, Bite It?


While it's better to wait until a stock is trading near it's 50 day MA and basing for six to eight weeks, watch AAPL if it closes above $75 on strong volume. You may get paid off for taking a bite.

Go East Young Man

Think the U.S. is the leading growth market for retail equity derivatives? Think again. Think kimchi and...well, read on at FT.com.

Is the Alleged Tight-Money policy Over?

From Bloomberg:
The number of rate increases needed to control inflation ``probably would not be large,'' yesterday's minutes from the Fed's December policy meeting showed. The ``measured'' phrasing was retained to avoid any suggestion of bigger rate increases, the central bank said.

No wonder they want to get rid of M3, managing 'inflationary expectations' is half the fun of it.

Wednesday, December 28

Market in the Rear View: Looking Forward


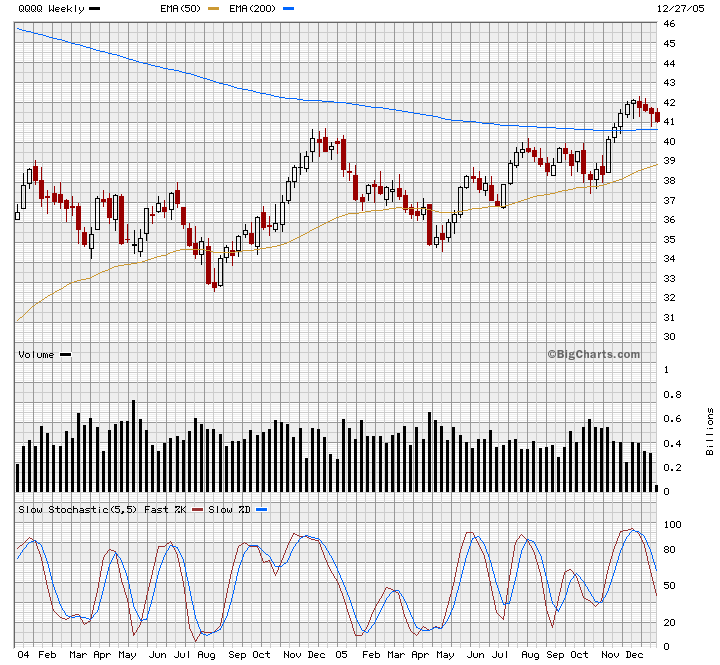
Using the qqqq as a proxy for the stock market, here is a two-year weekly chart showing the nasty fall the market took at the beginning of last year; dropping about 1/8th of its value in the first three months of the year and then using the Spring and the Fall to recover.

$40 has been the key level during this period for the q's, providing resistance to the upside, and will also provide support, when the stock starts to break lower.

This last end-of-the-year rally has been low on volume, and looks to be running out of steam. The return to the $40 level for a test will not be far off.

Short rates have risen and may continue to do so as the Fed attempts to fight the very real threat of rising prices, i.e. "domestic dollar devaluation"; a problem which was created, of course, by the Fed itself.

The yield curve has inverted, increasing the odds of a recession next year. An inverted yield curve simply means that it no longer pays banks and other financial institutions to do what they do: borrow short term money to lend it long term. It's selling something for less than you buy it for, over and over again.

When lending is unprofitable, the boss hits you over the head and tells you to knock it off. So all sorts of productive activity doesn't get financed and that means it doesn't happen. Business slows. Bubbles burst. people feel poorer.

What could prevent a recession from happening next year?

The always easiest answer is that the Fed could return to her old ways and start pumping it out again like the drunken prom queen she is. Stop kidding us honey, you know you love it!

Another very real possibility is that some kind of tax reduction legislation gets pushed through sparking another growth cycle with an unexpectedly big market upside.

The establishment fears deflation like a liberal fears virginity; odds are, they'll do whatever it takes...

Tuesday, December 27

Greenspan: The Trailer...

Stefan M.I. Karlsson, like Murray Rothbard before him, isn't pulling any punches when it comes to Alan Greenspan and his legacy.

"...apart from inflation and economic imbalances, the defining characteristic of the Greenspan Fed has been its dishonesty. We have already seen how Greenspan claimed to have mimicked gold standard conditions. Moreover, instead of admitting how he was responsible for the tech stock bubble through the creation of moral hazard and suppression of interest rates, he blamed the bubble on "irrational exuberance." And instead of admitting his role in creating the housing bubble, he denied that there was such a bubble. Later, when he admitted that the housing bubble was real, he spoke out against it as if he had nothing to do with having created it in the first place."

Wednesday, December 21

A Low Inflation Kind of Year?

The Labor Department tells us that we actually experienced Deflation in November--consumer prices dropped by 0.6%.

Bill Fleckenstein is approriately skeptical about the accuracy of the official "inflation" numbers put out by our public servants in Washington, D.C.

Sunday, December 18

Fed Abandons M3: what's up with that?

John Williams, at prudentbear.com, has some suspicions about the central bank's ending its publication of the broad monetary aggregate M3. What are they trying to hide?

Sean Corrigan over at the Mises.org blog takes an even bigger swing at it, foreseeing dire straits for the dollar and consequently much higher rates for the long bond.

On a separate note, here's a monthly 5 year chart of the anti-dollar, i.e., gold:

Saturday, December 17

Review: St. Jude Medical


STJ gave us a freebie, so we might as well take it and run.

We sold the Jan 45-50 put spread at $2.75 when the stock was trading at $47.75; now that the stock has gapped up quickly over the $50 mark up to $51.75 The put spread is $.70 bid, at $.85.

We'll buy it back for $.80 and we are out of the trade with a $1.95 profit ($195 per put spread).

We'll wait for the stock to come in again before taking on a new position. Volume is still way positive and the uptrend should continue. Watch for support at the 200 day MA.

Stock: China Medical Tech


CMED looks like it is resting before a strong move in one direction or the other. In the month of December the stock has quieted down and has found support above its 50 day moving average. But when it does move, will it be to the upside or downside?

The big reversal day in late November showed active sellers overwhelming the momentum buyers and bringing the stock price down to a more moderate rate of increase. But the uptrend is unbroken and a pullback was due. Now that the expectations for easy money have been diluted, the volume patterns show the stock is still being accumulated.

CMED is also listed in IBD's "New Buys of Top Performing Stock Funds" for November, meaning that some smart institutional money is buying it.

Furthermore, at least through the end of the year, we are in a very positive period for the stock market and so we ought not to bet against the upside.

I know what you're thinking: "let's get long the Jan 35-40 call spread for about $1.50 and see what happens".

Okay, good call. You're getting better at this.

Monday, December 5

Stock Watch: INGR


This is another strong stock with high Investors Business Daily ratings. It's uptrend continues with its current consolidation. Institutions would rather not buy a stock too far away from its fifty day MA so they often refrain from their planned accumulation when the stocks price gets too far away.

Now the stocks historical volatility has come in from 28 down to 18 but the implied vol in the options market is still up around 26.

Since we think the stock is going up and vol is high, we need to get long by selling premium. The preferred method is selling put spreads, rather than naked puts which leave us open to big losses.

The INGR Jan 45-50 put vertical is fair at 1.90--selling the Jan 50 put @ 2.40 and buyin the Jan 45 put for .50.

Let's sell the spread there and watch.

Monday, November 14

Example: Selling an STJ Put Spread


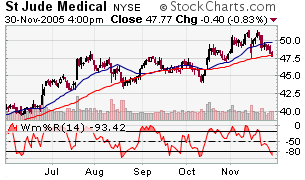
St. Jude Medical is a company with strong fundamentals in a solid group, and it has every reason to be in an uptrend. It formed an eight week base starting in August and broke above the buy point of 47 1/2 mid Oct. and up to 52, where it sold off and has returned to the 200 day moving average holding at 47 1/2. So how should you bet it?

Since the stock is still in an intermediate uptrend we look for a time and place to get long. The safest place is at the support of its long term averages when the stochastics are low and turn up, in this case when the williams% drops below -80, then heads back above it.

One way to make a bet that this stock will go higher from here is to SELL a put spread.

When the stock goes higher, the put spread will get cheaper. You can then buy it back at the lower price; or even better if the stock has moved high enough, let the price of the put spread go to zero at expiration and just pocket the money from the original sale.

The best thing about vertical spreads is that your losses are limited.

If you use strikes that are 5 points wide, like the STJ 45-50 put spread, its value will always be between $0 and $5. If you bought it for $1, the most you could lose would be $1; if you sold it for $1, the most you could lose is $4.

So let's look at the STJ Jan 45-50 put spread. With the stock at about $47.75, this put spread is trading for 2.75, or $275 apiece. Selling it there would put $275 into your acount now and if STJ went over $50 and stayed above it at the Jan expiration of those options, you would simply keep the money.

If STJ went below $45 and stayed there at the Jan expiration, you would lose the $275 plus another $225 of you own cash because the price of the put spread that you sold for 2.75, would go to 5. But you can buy it back at any time before expiration to get out of the trade, either to capture a profit or to keep from losing more.

Now with STJ in an uptrend and the stochastics about to turn up, let's paper trade the put spread, selling one at 2.75.

We'll watch it and update in the near future.

Sunday, November 13

Recent New High in the Q's


Here is the weekly chart of the Q's. A new high, yes, but where is the volume? over the last dozen weeks the volume was on the downside and now in the new rally the up weeks are tainted with modest trading activity.

Buying activity did pick up underneath the 50 day moving average, giving support there, but so far aggressive buying has been absent. If this is the start of the rally season, shouldn't there be more people in attendance? Hmm.

Okay, I'll keep a wait and see attitude. But the Fed rate hikes do continue, and this is the first year of the Presidency, classically the poorest performing of the four year Presidential cycle as the Fed tends to pull the punchbowl away after their election year manipulations have done their trick.

But rally time is rally time, and the market is showing better and broader leadership this time around.

The rotation has been out of the oil and housing stocks and into certain retail, financial, medical and transport stocks. More to come on the individual winners in the near future; stay tuned.

Friday, November 11

Real Estate Futures to Trade at the CME

Set to debut in April at the CME, this futures contract will be "based on the median home price in ten U.S. cities".

The exchanges are continuing to offer new products in an effort to compete with newcomers for order flow. Some have gone public already, and more will surely follow. Let's go to the charts to see how they're doing.


The ISE is an all electronic options exchange here in the U.S. in competition with the five others, four of which are floor-based. It has run up about 30% in the last month, and is at risk of a little correction as those holding paper profits might be quick to take some off the table. But the volume shows big accumulation and the stock is a great bet for the long haul. A good buy around $27 1/2 if it comes in.


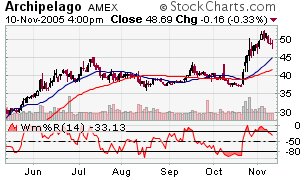
The Arca exchange has already started to come in after a quick runup from $40 on strong volume. As long as it continues to act well, it would be a great buy at $45, at the 50 day moving average.

The small group of publicly traded exchanges, which includes BOT, NDAQ and of course the CME, will continue to innovate and grow as public firms. They should be considered for the trading vehicles that they are, and also as good investments.

Thursday, November 10

Big Cap Stocks of the Week

Here are the charts of the highest rated big caps according to Investors Business Daily, based on their proprietary composite ratings.


Motorola looks great with strong volume on the up days, a convincing break above its 200 day moving average, and a methodical base building process as it approaches the break out point at $24. It would be best if it had one more shake out to form a handle, before the big volume break out to new highs.


St. Jude Medical is also in an orderly uptrend, with the big volume days on the upside. It is one of the leading stocks in the strong medical sector and is showing good action after its break out at $47 1/2. A break above $50 with the continued support of its 50 day average could leave this stock a longer-term winner.


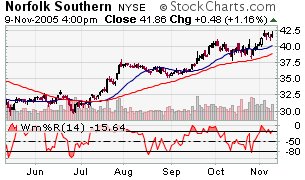
Norfolk Southern is in the very strong transports sector, has broken above a short-term base at $41, and shows the signs of volume accumulation and support in the moving averages.

The big caps tend to be less volatile, have a lot of liquidity, and have very active options markets behind them, leaving many ways to gain from their movements.

Now go forth and prosper.